
LESSON 13 – Atrial Flutter
The underlying mechanism of atrial flutter is similar to that of atrial fibrillation (AF). However, in atrial flutter, instead of chaotic electrical activity, there is one or more stable reentrant circuits.
As a result, atrial contraction becomes more or less coordinated, and the ECG demonstrates regular F waves.
It should be noted that atrial flutter can, under certain conditions, transition into atrial fibrillation and vice versa. In some cases, distinguishing between the two may be difficult or even impossible. In such situations, it is acceptable to conclude: “atrial fibrillation–flutter.” Nevertheless, before resorting to such conclusions, one should always attempt to differentiate between these arrhythmias.
Thus, the main ECG features of atrial flutter are:
- Absence of P waves.
- Presence of F waves instead of P waves, typically with a sawtooth pattern (although the classic “sawtooth” appearance is not always present), best visualized in leads V1 and V2.
At the same time, the atrial rate (not to be confused with the ventricular rate) typically ranges from 250 to 400 beats per minute. This corresponds to an F–F interval of approximately 150–300 ms, or, in practical terms, 3.75–7.5 mm at a paper speed of 25 mm/s.
As a general rule:
- 400 bpm — atrial fibrillation
- 250–400 bpm — atrial flutter
- <250 bpm — another supraventricular tachycardia
Of course, atrial flutter has additional features and several distinct forms, which we will now explore in the practical section. It is also important to note that, in clinical practice, the most relevant classification of atrial flutter is into typical and atypical forms. You should be aware of this distinction; however, it falls outside the scope of this course and will not be discussed further.
Let us consider several ECG examples of atrial flutter
ECG Example 1 – Atrial Flutter
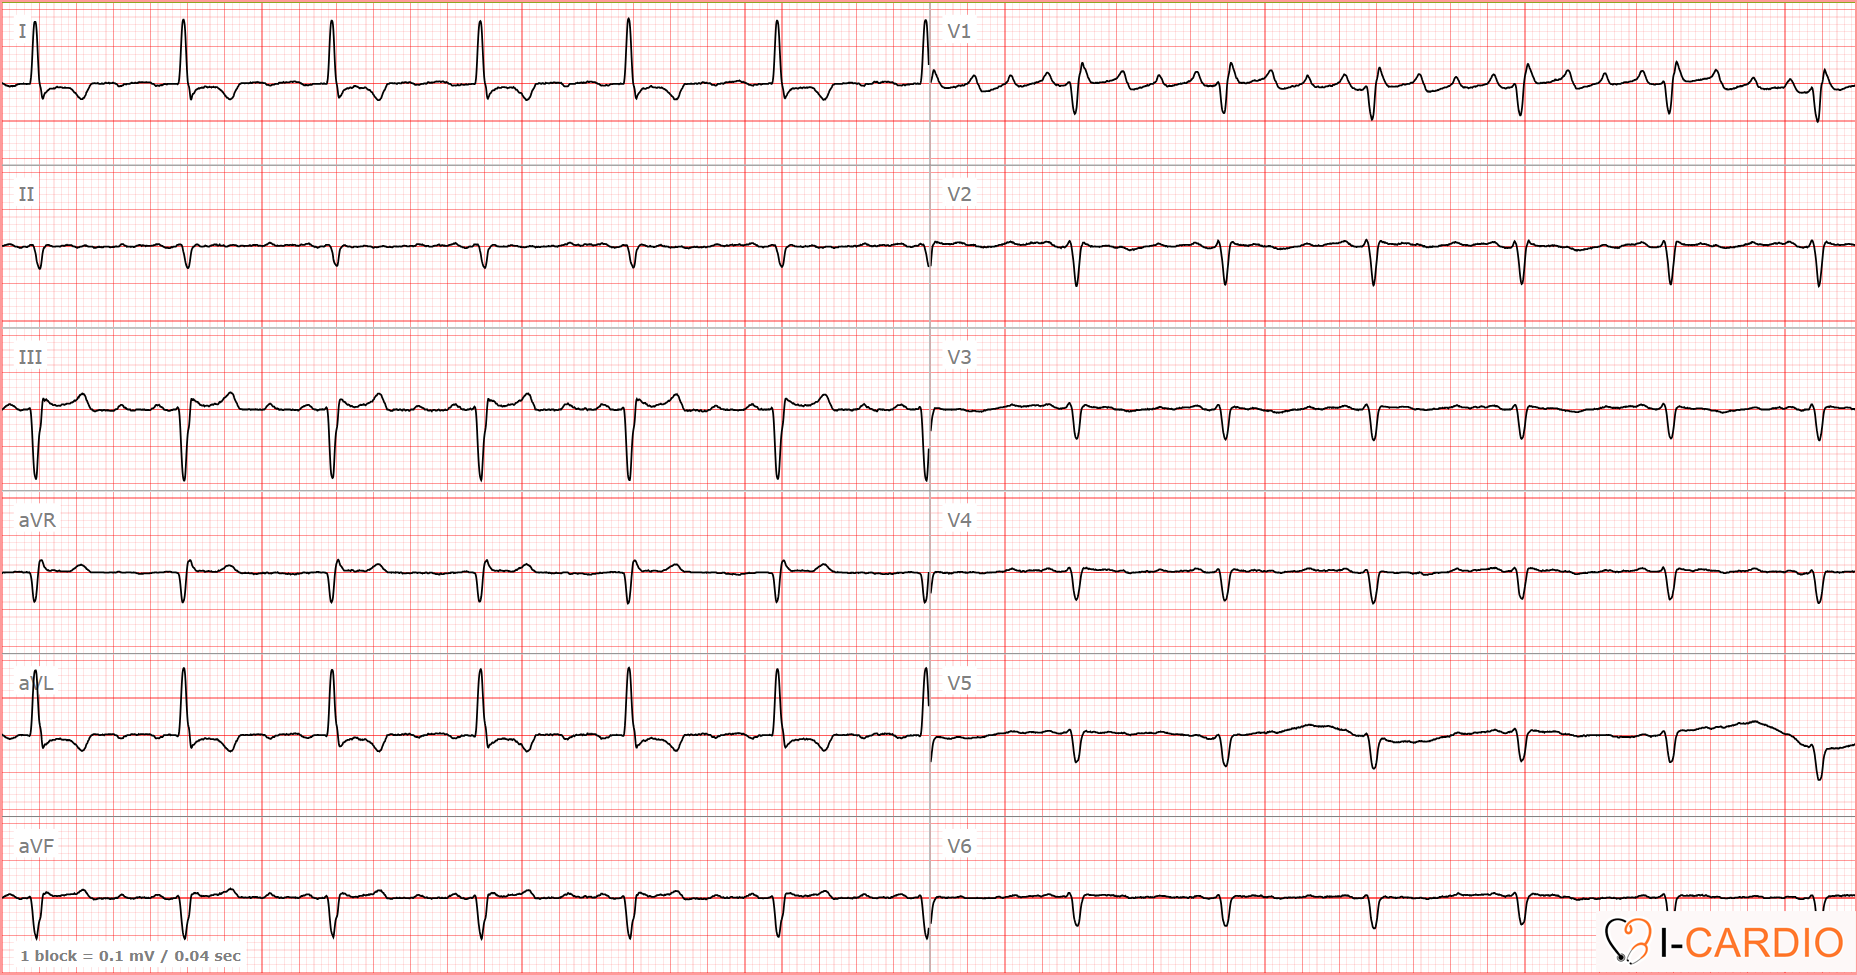
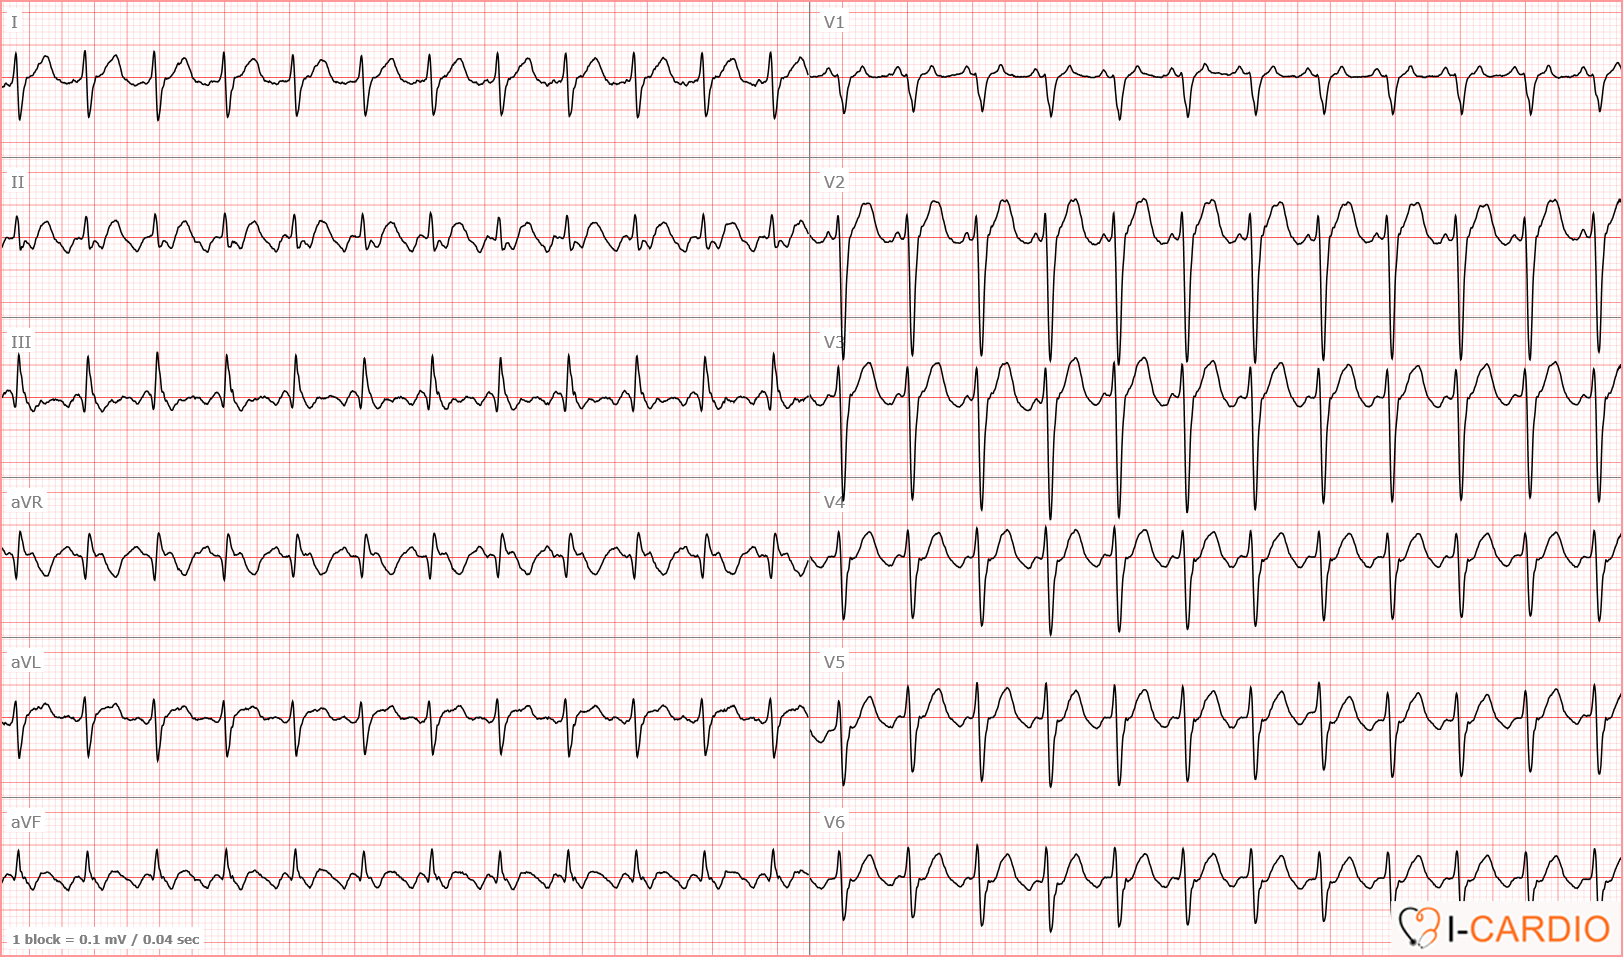
This ECG demonstrates a regular ventricular rate of approximately 75 bpm; however, attempts to identify P waves in lead II are unsuccessful.
Of course, with sufficient experience, one may notice waves occurring in a certain sequence, but this is not essential. If P waves are not identifiable in lead II, they should be sought in leads V1 or V2.
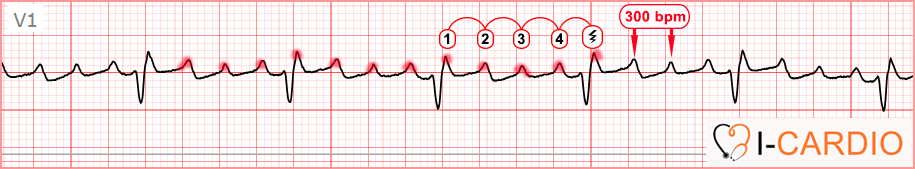
In these leads, the pattern becomes clear: you can see regular F waves. The distance between successive peaks is 5 small squares, corresponding to an atrial rate of 1500/5 = 300 bpm.
In some segments, F waves are superimposed on the R waves. A consistent conduction pattern is observed, with every fourth “atrial impulse” conducted to the ventricles, consistent with atrial flutter with 4:1 AV conduction.
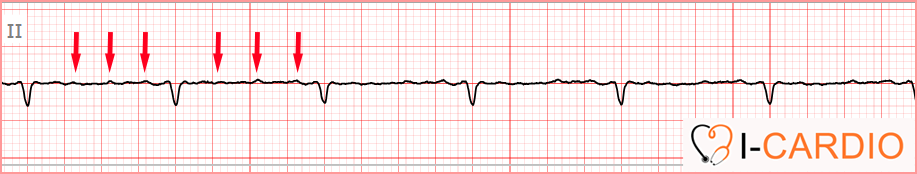
ECG Example 2 – Atrial Flutter
In this ECG, flutter waves are visible in lead II.
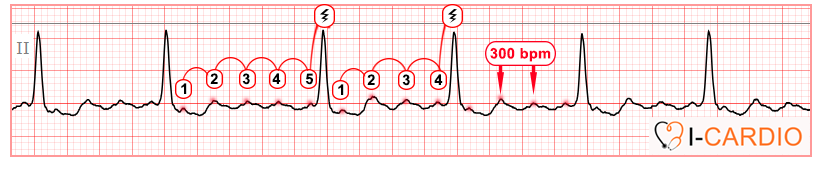
This tracing demonstrates a pattern of variable AV conduction, alternating between 5:1 and 4:1, resulting in an irregular ventricular rate, similar to atrial fibrillation. However, the atrial rate of approximately 300 bpm and the regularity of the flutter waves are characteristic of atrial flutter rather than atrial fibrillation.
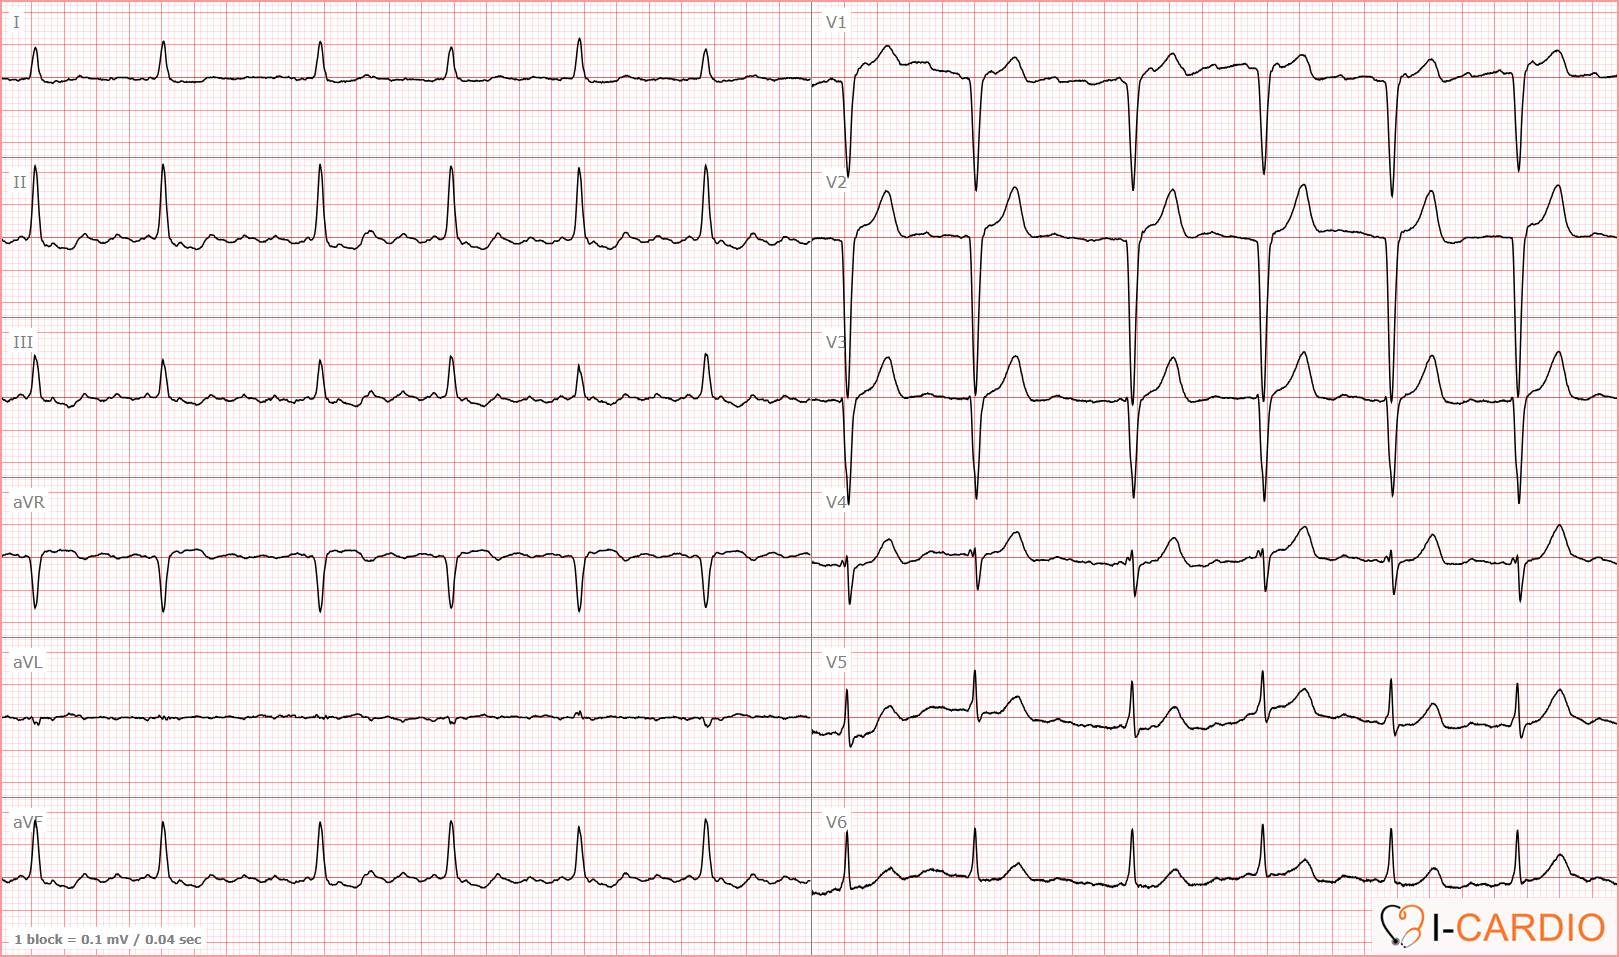
ECG Example 3 – Atrial Flutter
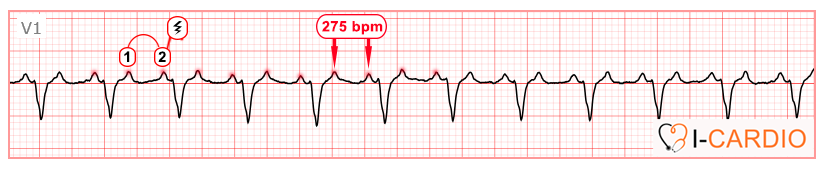
This ECG clearly demonstrates regular atrial activity with a rate of approximately 275 bpm, consistent with atrial flutter. Only every second impulse is conducted to the ventricles, corresponding to a 2:1 AV conduction ratio.
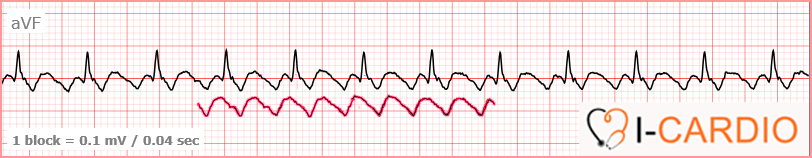
You may ask: where is the classic “sawtooth” pattern? First, it is not always present. Second, it requires careful inspection — and a certain degree of “clinical imagination” — to recognize it. Now look at lead aVF on the same ECG. I have shifted the F wave downward for better visualization.
That’s enough theory — let’s proceed to a practical task focusing on atrial flutter and atrial fibrillation, while also incorporating rhythms you have already learned.